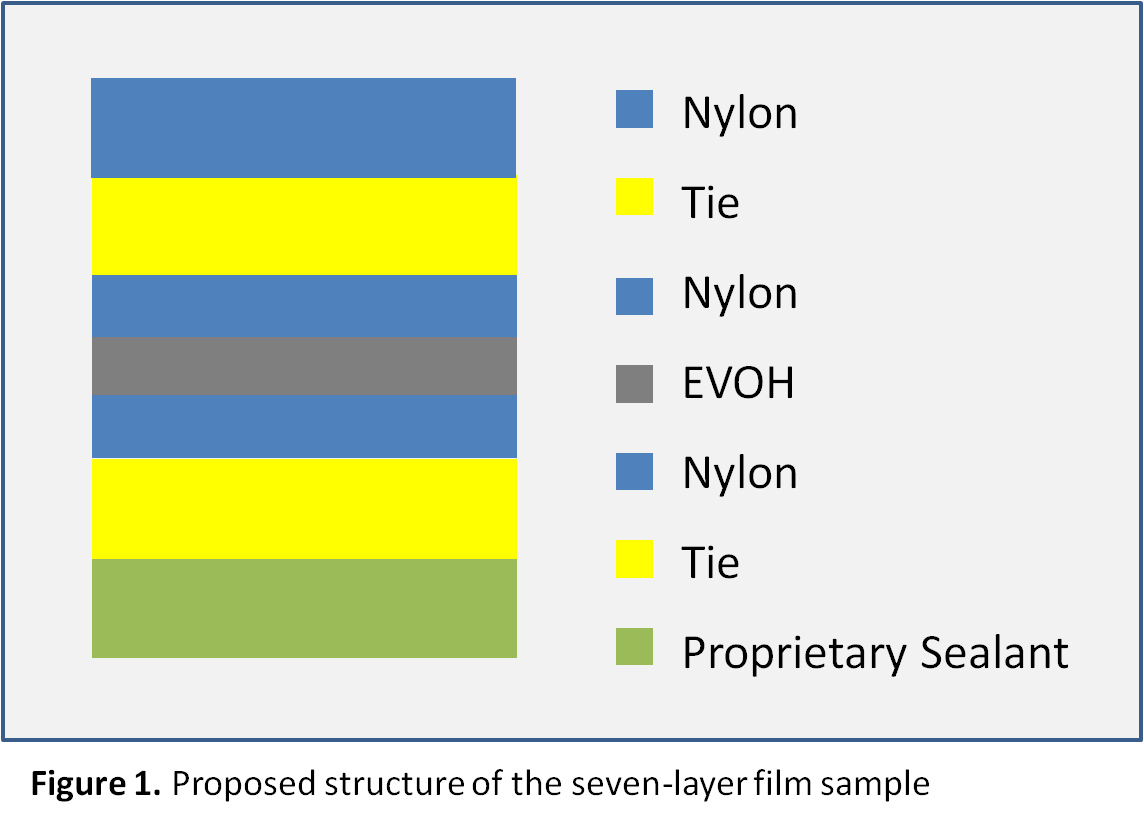
Polymer Solutions Incorporated (PSI) was contacted with a request to confirm that a film sample matched its proposed seven-layer construction. The proposed construction was provided, as shown in Figure 1. It was of interest to determine the number of layers, as well as the identities of each layer, of the film, as described below.
The film sample was tested using Differential Scanning Calorimetry (DSC). This analytical technique reveals the thermal transitions that occur within a material. A specimen weighing approximately 7 mg was hermetically encapsulated in aluminum DSC sample pans for analysis. Printed labeling was intentionally avoided so that only the film material was tested. The specimen was equilibrated at -80°C, heated to 300°C and equilibrated, cooled back to -80°C and held isothermally for 5 minutes, then finally reheated to 300°C, all with a temperature ramp rate of 10°C per minute and in a nitrogen environment. The transitions in the first heating cycle are affected by the thermal and physical histories of the specimen while those in the second heating cycle are more indicative of the materials’ inherent properties.
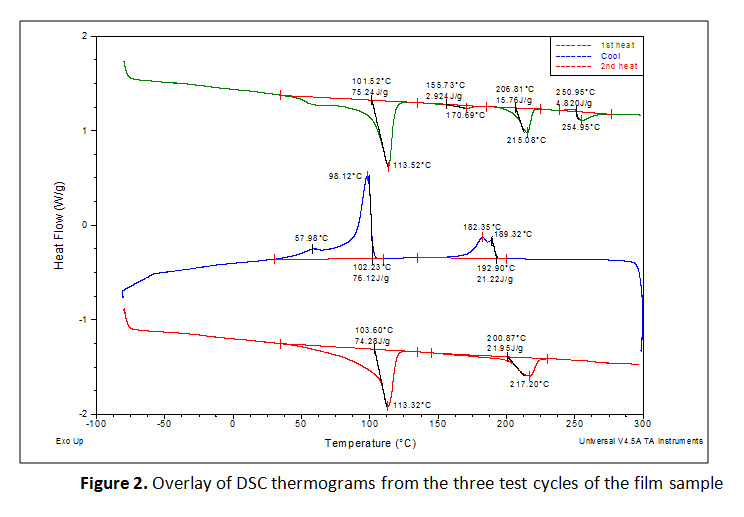
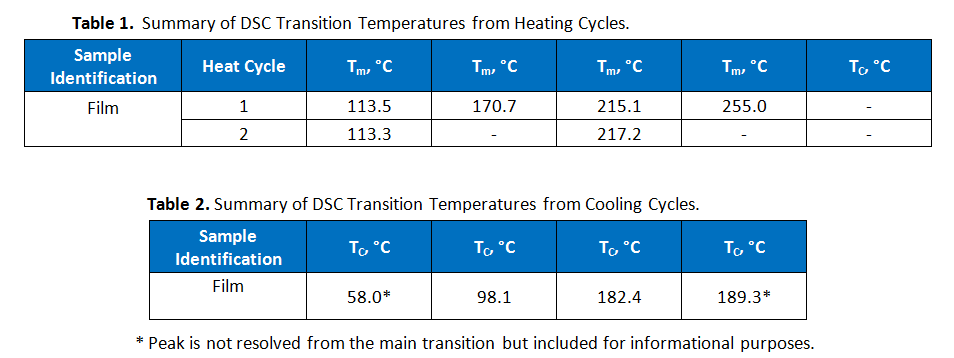
The first heating cycles exhibited multiple endothermic transitions. Each transition was integrated to measure the peak melt transition temperature (Tm), which provides information about the resins used. The exothermic transition in the cooling cycle was also integrated to measure peak crystalline transition temperatures (TC). Where a prominent secondary peak is present, the transition was integrated for net heat flow and the secondary peak temperature was marked. The three test cycles were overlaid together and the curves were vertically offset from one another so that the markings are legible, as presented in Figure 2. The results are summarized in Tables 1 and 2.
The sample was also analyzed by Fourier Transform Infrared (FTIR) Spectroscopy in attenuated total reflectance (ATR) mode. This technique was used because it can be used to identify compounds or investigate sample composition. Both surfaces were examined in “as-received” condition by bringing them into contact with the ATR crystal. Spectra were corrected for water, carbon dioxide and baseline, and searched against a library of reference spectra. Additionally, portions of film were cut into shapes so as to allow original orientation to be determined, and then immersed in a mixture of chloroform and trifluoroethanol, to dissolve any nylon layers present. Any layer obtained in this manner was examined on both sides using the method described above.
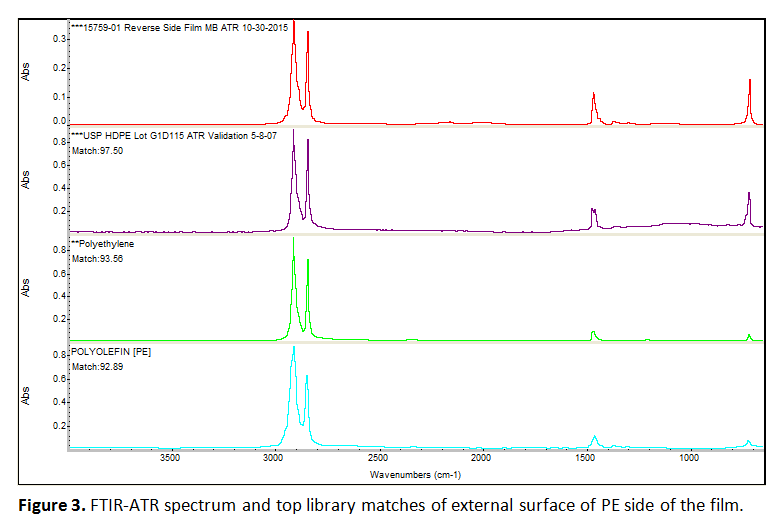
There were no visual markings to distinguish the sides. Therefore, one of the outer surfaces, which was found to be polyethylene (PE), was arbitrarily assigned as the top layer for discussion purposes. Figure 3 shows the spectrum for the external surface of this PE top layer, as an example of the data produced. Note that FTIR cannot readily differentiate between types of polyethylene (low density versus high density), but the DSC results suggest this may be low density PE.
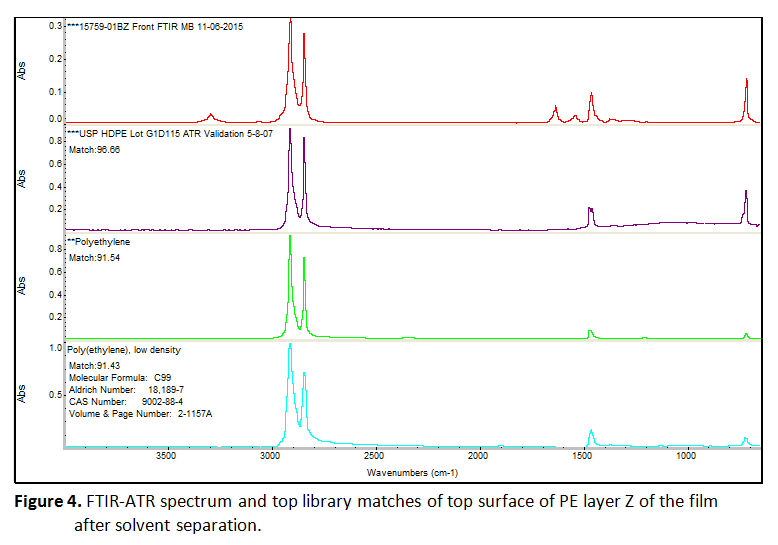
Separation of this film as described above yielded three layers, which are designated as X, Y, and Z. Two of these layers were found to be PE. Figure 4 shows an example of this data. Since the dissolution process involves shaking of the films within the solvent, absolute orientation was lost. However, one of these PE layers is the original top surface, and the other is a PE film from the interior of the sample. An additional internal layer was removed, which was initially swollen in appearance before the layers were dried. This material matched vinyl alcohol copolymer (ethylene vinyl alcohol or ethylene vinyl acetate, EVOH or EVA. The external surface of the bottom of the film matches polyamide (nylon).
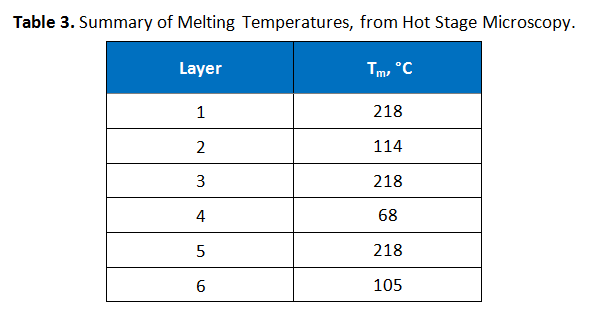
Hot stage microscopy, also known as thermomicroscopy, was performed to determine the melting points of the various layers. A portion of the film was embedded in epoxy, microtomed and then the slices were sandwiched between two microscope slides. The temperature was initially ramped from room temperature at 20°C per minute until the first melting was observed, after which ramping continued at 10°C per minute at a magnification of 400x. These results are summarized in Table 3.
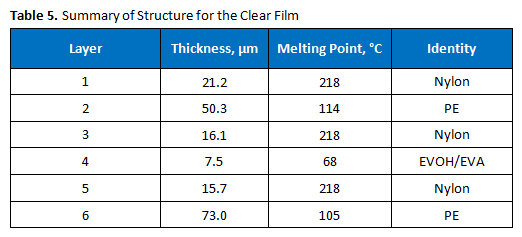
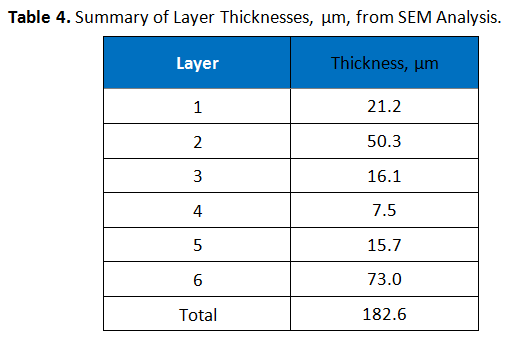
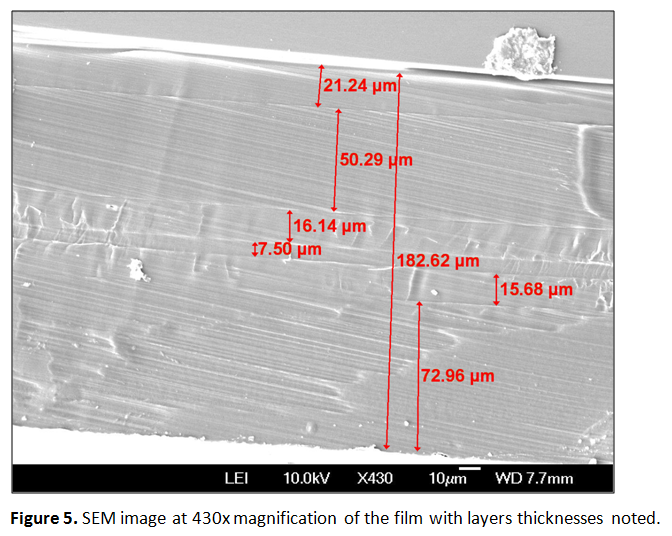
The cross-section, as prepared for hot stage microscopy testing, was also examined using Scanning Electron Microscopy (SEM). Prior to the analysis, the sample was sputtered coated with a 10 nm layer of gold to prevent electrical charging. Image analysis software was used to measure the thickness of the layers observed. These thicknesses are summarized in Table 4. Table 5 shows an image obtained from the SEM analysis, with measurements indicated.
Conclusions
Our client came to us to determine if their film matched the proposed seven-layer structure. Our data indicated that it did not. The film structure is summarized in Table 5. Only six layers were observed by each microscopy method, although the proposed structure indicated there should be seven. It appears that layer 6 is serving the dual function of being a tie layer and the bonding layer, as shown in Figure 1. The assignment of several of the internal layers as nylons is based on the melting points and the infrared spectra.