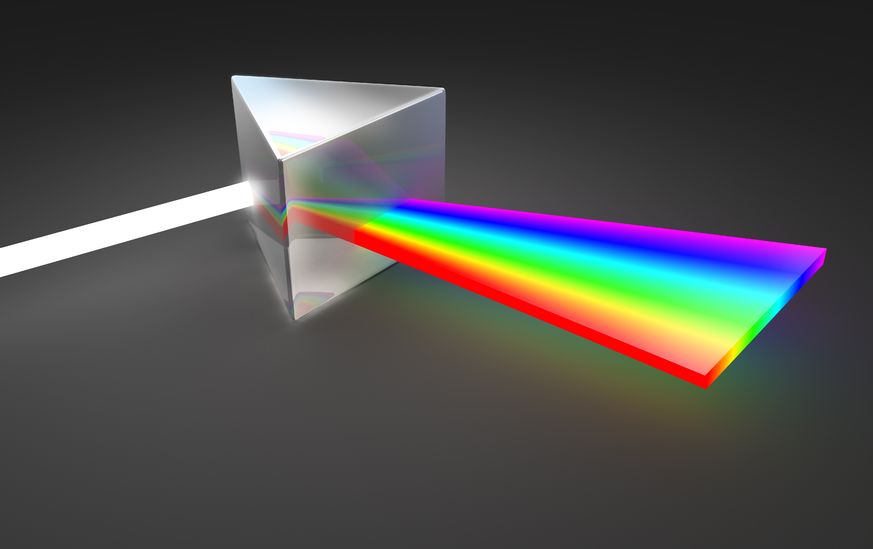
It started with light. The word spectroscopy is derived from two words: spectrum, which means image in Latin, and skopia, which means observation in Greek. In the 17th century, Isaac Newton used the word spectrum as a scientific way to describe the rainbow set of colors obtained by passing a sunbeam through a prism. Later it was extended to cover all frequencies of electromagnetic radiation, from long radio waves to short gamma rays, i.e., the electromagnetic spectrum.
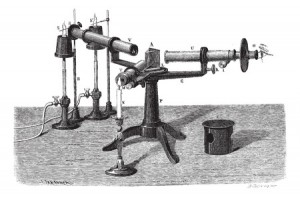
Spectroscopy became a scientific tool in 19th century with the spectrochemical analysis of material composition established by the German scientists Gustav Kirchhoff and Robert Bunsen. As many as 16 Nobel prizes were awarded in the 20th century in the field of spectroscopy. Currently, spectroscopic analysis is one of the most common analytical approaches, applicable from atoms to stars. How can a method be so versatile?
Family of Techniques
The term spectroscopy is used to describe a family of analytical techniques, in which a range of frequencies (light, UV, IR, etc.) is applied to materials to obtain spectral characteristics, or the spectra of these materials in a form of a graph. The materials spectra are obtained due to the unique interaction of material components with certain frequencies of electromagnetic waves (such as absorption or emission), so here the word spectrum is used typically to describe a graphic representation (intensity versus frequency) of the unique properties of the material. Comparing the spectra, overlaying, or superimposing spectra of closely related materials on the same graph allows the pinpointing of differences between them. In addition to the term spectroscopy, spectrometry and spectrography are also commonly used.
Analytical spectroscopy is defined by the range of the electromagnetic waves interacting with the material, such as ultraviolet-visible, infrared, X-ray, radio, or microwave frequencies. The interactions of the material and the electromagnetic waves include absorption, emission, reflection, refraction, resonance, scattering, and impedance. The specific interaction of the material and the electromagnetic energy can take place and characterize the material on different levels, such as nuclear, atomic, molecular and supramolecular scales. In other words, depending on the method and the source of electromagnetic waves, one can obtain information about the atoms, molecules, or crystal structure of the material.
The equipment used for spectroscopic analysis depends on the method and can be of increasing complexity. If a material to be studied is soluble, already a transparent liquid, or a thin film or a coating, the analysis often starts with UV-visible spectroscopy (UV-Vis). Let’s take a closer look at a tool present in almost any analytical laboratory, a UV-Visible Spectrometer, which is useful for a wide variety of applications.
Modern Methods
Modern spectroscopy methods include Nuclear Magnetic Resonance Spectroscopy (NMR), Fourier Transform Infrared Spectroscopy (FTIR), X-ray Fluorescence Spectroscopy (XRF), Inductively Coupled Plasma Analysis Spectroscopy (ICP), and many others. Spectroscopy methods, combined with other analytical techniques, offer a double advantage. For example, Scanning Electron Microscopy with Energy Dispersive Spectroscopy (SEM/EDS) is used not only to analyze structure, but also chemical composition with very high resolution, or Gas Chromatography-Mass Spectrometry (GC-MS) can detect the faintest aroma.
A good example of everyday application of spectroscopy is on-site material analysis, performed with a variety of portable spectrometers of different functions (FTIR, Raman, UV-Vis and XRF), allowing to test “samples” the size of an airplane or contaminants in ultralow concentrations.
Spectroscopy truly serves science in previously unimaginable ways and it all started with light. As Isaac Asimov said, “There is a single light of science, and to brighten it anywhere is to brighten it everywhere.”
Image by alexmit/123RF.
Illustration by morphart/123RF.
Video: Ultraviolet/Visible Spectroscopy (UV-Vis) by the Royal Society of Chemistry.
Source: The History of Spectroscopy, A Perspective, MIT Spectroscopy, web.mit.edu.
Source: Food dye analysis (PDF), Royal Society of Chemistry, 2009.
Source: Book: “UV-visible Spectrophotometry of Water and Wastewater,” by Olivier Thomas and Christopher Burgess, Elsevier Science, April 27, 2007.